LEGEND FOR ABOVE FIGURE
DEMONSTRATING
THE INTERNAL STRUCTURE AND COMPLEXITY
OF MITOCHONDRIA*
Note: These pseudo-3D images normally
require special goggles to provide a 3-D feel.
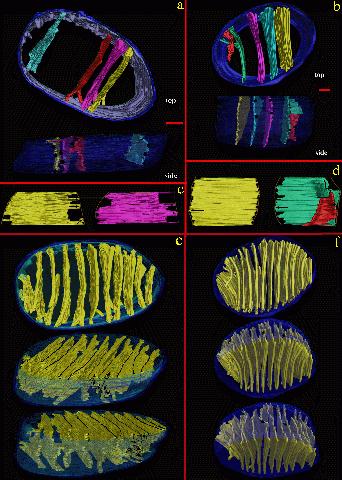
(a) Surface-rendered volume of a chemically fixed mitochondrion. Top: Four segmented cristae (out of 10 total) showing lamellar topology are displayed as are the outer (dark blue) and inner boundary (light blue) membranes. The mitochondrion length (long axis) is ~850 nm. Side: The crista junction openings, which connect the intermembrane space with the intracristal space, are shown in black. The height of the segmented volume is ~200 nm and represents the portion of the volume that displayed clear features. Scale bar = 100 nm. The scale bar also applies to 4c and 4e.
(b) Surface-rendered volume of a cryofixed mitochondrion. Top: Five segmented cristae (out of 16 total) showing lamellar and branched topology are displayed. The outer and inner boundary membranes were not resolved in cryofixed specimens and hence were segmented together. The mitochondrion length is ~1000 nm Side: The crista junction openings are shown in black. The height of the segmented volume is ~480 nm. Scale bar = 100 nm. The scale bar also applies to d and f.
(c) Perpendicular views of two of the cristae shown in (a). Crista junctions are indicated by arrows and the peripheral membranes by an orange curve. These views highlight the lamellar nature of BAT cristae and show the relatively large openings along the periphery that connect one matrix space with the next.
(d) Perpendicular views of three of the cristae shown in (b). The bluish-green crista is branched and the smaller compartment (red) extends less than half of the length (top to bottom) of the major compartment. Crista junctions are indicated by arrows.
(e, f) Views rotated about selected axes of the completely segmented volumes of the reconstructed mitochondria of (a) and (b) respectively, showing all the cristae in greenish-yellow. The peripheral membranes (in blue) were made translucent to be able to fully visualize the cristae. The same crista junctions emphasized in (c) and (d) are also demarcated by arrows to highlight the spatial relationship to adjacent cristae shown in different orientations. An additional junction is marked in (f) because of its prominence in the center of the image.
* Source: The above image was obtained from Guy Perkins at UCSD:
Dr. Guy A. Perkins, Ph.D.
National Center for Microscopy and Imaging Research
Department of Chemistry and Biochemistry
School of Medicine
University of California at San Diego
La Jolla, CA 92093-0608
E-mail: perkins@alex.ucsd.edu
Reference:
Guy A. Perkins, C. W. Renken, J. Y. Song, T. G. Frey, S. J. Young, S. Lamont, M. E. Martone, S. Lindsey, and M. H. Ellisman, "Electron Tomography of Large, Multicomponent Biological Structures," Journal of Structural Biology, Vol. 120, pp. 219-227 (1997).